Inclusive Economy Indicators for Electoral Wards
Published: 4 December 2024
Introducing the NEW SIPHER Inclusive Economy (Ward Level) Dataset: Advancing Our Understanding of Economic Inclusion at the Electoral Ward Level Across Great Britain.
Research has shown that people living in more inclusive economies experience less deprivation, better health, and have greater physical and mental wellbeing. Today, equitable access to services and opportunities is at the forefront of policy planning at both local and national levels.
In our previous SIPHER blog post, Measuring the Inclusive Economy, we outlined how an inclusive economy can be captured through data. This blog explores our new SIPHER Inclusive Economy (Ward Level) Dataset, which offers detailed insights for small geographical areas to support researchers and policy makers looking to turn commitments into actionable strategies.
Introducing the SIPHER Inclusive Economy (Ward Level) Dataset
Launched in November 2024, the SIPHER Inclusive Economy (Ward Level) Dataset is a comprehensive resource for understanding economic inclusion across electoral wards in Great Britain. It draws on the SIPHER Synthetic Population, and builds on understandings gained through our work on the SIPHER Inclusive Economy (Local Authority Level) Dataset.
Covering all electoral wards in England, Wales, and Scotland, this unique dataset offers valuable intelligence into inequalities across wards and within larger areas such as local authorities or regions. By combining inclusive economy indicators with demographic and wellbeing data, the dataset offers an evidence base for tackling inequality and fostering transparency in decision-making. It spans a three-year period (2019-2021) and includes an interactive data visualisation tool to facilitate different analyses.
What is Economic Inclusion?
At SIPHER, we focus on economic inclusion as a driver of more equitable health and wellbeing. While there is no universally agreed definition of economic inclusion, our approach highlights three key aspects (see Macintyre et al., 2024, in further reading section):
- Deliberate design of an economy to be inclusive.
- Equitable distribution of economic benefits.
- Fair access to resources necessary for economic participation.
Our goal was to develop a collection of indicators that captures the core concept of economic inclusion without unnecessary complexity. Our SIPHER Inclusive Economy (Ward Level) Dataset sheds light on these aspects of inclusion by capturing a range of indicators that incorporate, for example, housing, education and employment. As such, the dataset quantifies and compares multiple aspects of people’s everyday lives and allows users to explore the association between economic inclusion and wellbeing across small geographic areas.
For more detailed information on our motivation to capture the inclusive economy, see our earlier SIPHER blog post, What Is An Inclusive Economy – And How Do You Know If You’ve Got One?. Our SIPHER Inclusive Economy Indicator Set: Technical paper [PDF] also describes the process of identifying and selecting candidate indicators in detail.
Addressing the Lack of Small-Area Data
A major challenge in creating inclusive economy indicator datasets for the UK lies in the scarcity of harmonised, small-area data on economic inclusion. While the UK’s Indices of Multiple Deprivation offer valuable information, their methodologies and definitions of indicators vary across each of the four nations, complicating cross-country comparisons. We addressed this scarcity of data by using a hybrid data sourcing approach.
Our dataset is the result of an iterative co-production process. SIPHER colleagues and researchers, policy partners and experts on our Inclusive Economies and Housing Advisory Group were involved in an initial consultation process. We then drew from a variety of open, administrative, and bespoke research datasets, and also leveraged the SIPHER Synthetic Population – a digital twin of the population in Great Britain. This methodology ensured consistency across small geographical areas.
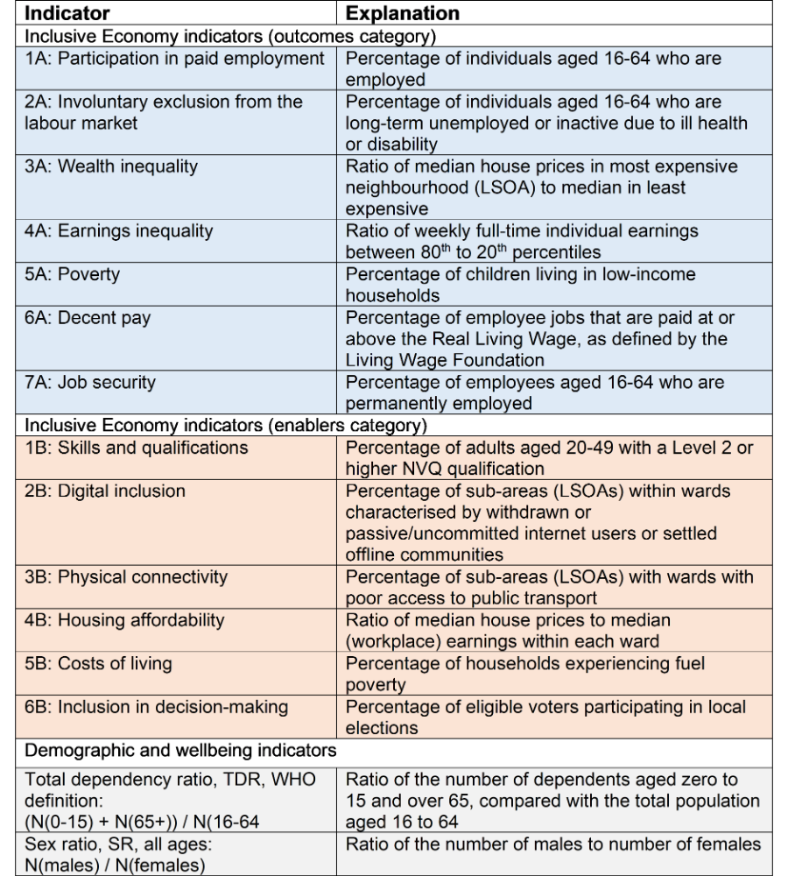
Our dataset comprises 13 inclusive economy indicators, which fall into two groups:
- Economic outcomes (e.g., income, employment).
- Wider outcomes and enablers of economic inclusion (e.g., housing, education).
Table 1 provides a summary of all indicators captured in our dataset.
Table 1. A summary of all indicators captured in our SIPHER Inclusive Economy (Ward Level) Dataset.

SIPHER Synthetic Population
Eight of the dataset’s 13 inclusive economy indicators were derived from the SIPHER Synthetic Population. Built from longitudinal survey (UK Household Longitudinal Study – Understanding Society) and several administrative sources, this provides individual-level high-quality data into characteristics such as age, sex, ethnicity, and other personal attributes.
Capturing Health and Demographic Structure
In addition to the 13 economic inclusion indicators, our dataset includes demographic indicators for electoral wards, reflected by the total dependency ratio and the sex ratio. To make the dataset as comprehensive as possible, we also provide measures of population health and wellbeing using the 12-Item Short-Form Health Survey (SF-12). The SF-12 is a widely used health questionnaire and captures a person's self-reported health and wellbeing. In our dataset, we provide one summary score for both dimensions of the SF-12 tool, which accounts for the age structure of a ward’s population:
- SF-12 Physical Component Scores (PCS), capturing physical functioning, pain, and limitations due to physical health problems.
- SF-12 Mental Component Scores (MCS), capturing wellbeing, emotional distress, and social participation.
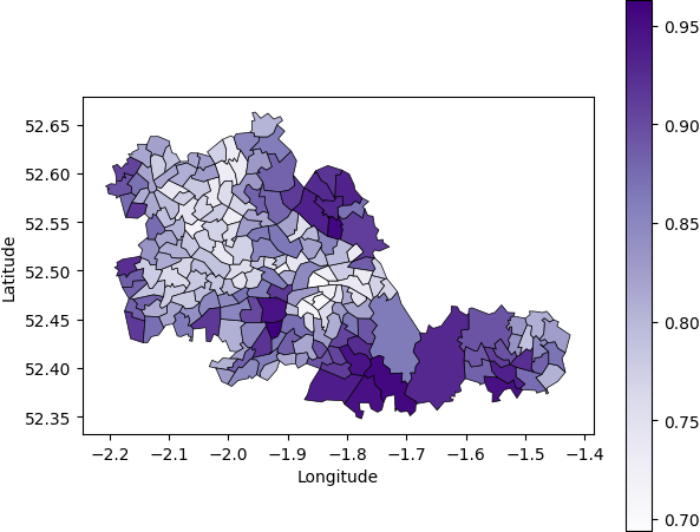
Both metrics are derived from the SIPHER Synthetic Population and offer a nuanced understanding of how economic inclusion across Great Britain intersects with health and wellbeing. Our interactive data visualisation allows users to easily explore all these aspects. An example visualisation of Indicator 1B (skills and qualifications) shows the percentage of residents with NVQ2+ qualifications for wards in the West Midlands Combined Authority – see Figure 1.
Figure 1. Proportion of residents (where 1.0 = 100%) with high-level qualifications (NVQ2+ equivalent) (Indicator 1B) amongst wards in the West Midlands Combined Authority.

Supporting Policy for a Healthier Future
The SIPHER Inclusive Economy (Ward Level) Dataset was developed collaboratively through a series of workshops and discussions with SIPHER’s academic and policy partners. By combining detailed economic, demographic, as well as health and wellbeing data at an unprecedented small scale, it provides clear actionable insights into the relationships between economic inclusion and health outcomes. We believe this dataset stands as a vital tool for fostering transparency, innovation, and collaboration in policy development.
The dataset is publicly available for downloaded via the Open Science Framework.
For access visit Links and further reading at the end of this blog.
Key Features of the SIPHER Ward-Level Dataset
- Area Coverage: 7,973 of 8,020 electoral wards in England, Wales, and Scotland with 47 excluded due to low population.
- Years Covered: 2019–2021.
- Indicators: 13 inclusive economy metrics, supplemented by demographic and wellbeing data.
- Interactive Tool: Explore data through an accessible visualisation tool.
For more information or to collaborate, please reach out to the SIPHER team at sipher@glasgow.ac.uk.
The views and opinions expressed in this blog are those of the author/authors.
Links and further reading:
- SIPHER Inclusive Economy (Ward Level) Dataset:
- Inclusive Economy Dataset: Open-access resource at the Open Science Framework.
- Interactive data visualisation: Web-based tool hosted by the CDRC.
- Product Guide – Inclusive Economy Dataset: Technical details of the dataset including strengths and limitations, and option to directly compare with other SIPHER products.
- Existing Indicator Sets Workbook [XLSX]: A detailed description of indicators proposed by policy partners during dataset development.
- What is an Inclusive Economy - and how do you know if you've got one?, SIPHER blog post (published: 20th August 2021).
- SIPHER Inclusive Economies and Housing Advisory Group, Experts and policy partners consulted during dataset development.
- SIPHER Inclusive Economy Indicator Set: Technical paper [PDF], Details on dataset development process, revised June 2023.
- A synthetic population dataset for estimating small area health and socio-economic outcomes in Great Britain, Wu et al, 2022, Nature Scientific Data 9, art. 19 (11 p.)
- Inclusive Growth Indicators for Cities: considerations and options - Inclusive Growth Analysis Unit, University of Manchester, Ceri Hughes, Briefing Paper 6, August 2017 (PDF).
- Knowing the goal: an inclusive economy that can address the public health challenges of our time, Shipton D. et al., 2020, Epidemiology and Community Health 75 (11), pp. 1129-1132.
- Assessing the effects of population-level political, economic and social exposures, interventions and policies on inclusive economy outcomes for health equity in high-income countries: a systematic review of reviews, Mcintyre et al., 2024, Systematic Reviews 13, art. 58 (24 p.).
- Bold action is needed to strengthen primary prevention, Meier P. et al., 2023, British Medical Journal 380, p. 595 (2 p.).
- Levelling up the UK: is the government serious about reducing regional inequalities in health?, Ralston R. et al., 2022, British Medical Journal 377, e070589 (4 p.).
- Estimating quality-adjusted life expectancy (QALE) for local authorities in Great Britain and its association with indicators of the inclusive economy: a cross-sectional study, Höhn et al., 2024, BMJ Open 14 (3), e076704 (11 p.)
- Collaborative Trailblazing: GMCA Devolution Deal and SIPHER’s support to tackle inequalities, SIPHER blog post (published: 6th July 2023).
First published: 4 December 2024
<< Blog

By Hugh Rice Researcher University of Leeds, Andreas Hoehn Researcher University of Glasgow and Nik Lomax SIPHER Lead Data & System Monitoring /Policy Microsimulation University of Leeds

