

Creating Data for Entire Populations
Published: 15 October 2024
Exploring the SIPHER Synthetic Population: A tool for policymakers and researchers that overcomes real-world data limitations.
Individual-level data for entire populations is often difficult to access for researchers and policymakers. We explain how readily available synthetic population datasets can fill data gaps and contribute important evidence when tackling health inequalities.
When "real" data isn’t good enough
Policy and research require high-quality data. Typically, both fields need data that reflects individuals or households - and captures different life domains such as health, income, employment, or housing.
While real data is usually the best choice when modelling real-world systems, it isn’t always available or accessible for the specific contexts we want to explore. Some real data, such as data from administrative sources, is highly confidential and can be difficult to access. In other cases, real data might be easily accessible but not suitable for the specific purpose. For example, while surveys are often a good alternative to administrative data, the information captured may not be representative at smaller levels of geography such as local authorities.
Synthetic data can help us to overcome some of these limitations.
What is "synthetic" data?
Unlike real data, which is typically collected, synthetic data is usually generated through a statistical process such as a model or an algorithm. The process of creating synthetic data often draws on real data sources like surveys, population statistics, or even confidential administrative data. Depending on the purpose and method used, synthetic data can range from broad representations of data structures to detailed patterns and relationships. In some cases, the statistical creation process can be optimised so that the synthetic dataset can be considered a "digital twin"— reflecting a close representation of a real-world population.
SIPHER Synthetic Population
At SIPHER, we have created a “digital twin” that represents over 50 million synthetic individuals across England, Scotland, and Wales. Our dataset provides a snapshot of the adult population in Great Britain between 2019 and 2021. Supporting a wide range of applications—from identifying emerging issues and needs to assessing policy options and evaluating their impact on population health—our SIPHER Synthetic Population is a high-quality, full-scale dataset that is readily available and accessible for researchers and policymakers.
Creating a full-scale synthetic population
The SIPHER Synthetic Population is based on two sources:
- UK Census 2011 and more recent population estimates
These publicly available population statistics data provide a summary of the sociodemographic characteristics of individuals and households across small areas. In Scotland, these areas are called Data Zones while they are referred to as Lower layer Super Output Areas in England and Wales. Across Great Britain, there are over 40,000 of these small areas, each covering about 500 to 3,000 people.
- The UK Household Longitudinal Study - Understanding Society
Understanding Society is the UK’s largest and longest-running survey. The survey covers many different topics, capturing a wealth of information about individuals and households. Data for the survey is collected from a large, nationally representative sample of UK households, with extra data gathered from specific groups such as immigrants and immigrants’ descendants in densely populated areas. This means that our synthetic dataset benefits from the diverse range of population subgroups and their unique life courses captured by the survey.
We combined both data sources through an algorithm called ‘simulated annealing’. The algorithm draws a random sample of individuals from the survey and compares the draw with information captured in the population statistics data for the particular area. The algorithm then adjusts the random draw to achieve the closest overlap between the pool of individuals drawn and the population statistics data.
Although real survey data is used throughout this process, all results obtained from the synthetic dataset should always be viewed as "model outputs". We are grateful to both, the UK Data Service and the Understanding Society team for their support during the creation, quality control, and distribution of our SIPHER Synthetic Population.
Case Study: Assessing alcohol-related harm across Greater Manchester
The SIPHER Synthetic Population has been used in a project which provided insights on alcohol-related harm across Greater Manchester. The project was run by the NHS Greater Manchester and the Greater Manchester Combined Authority. In addition to the synthetic population, the project utilised hospital records from the Integrated Care System, as well as the National Drug Treatment Monitoring System (NDTMS) across five local authorities - Bolton, Bury, Rochdale, Salford, and Trafford.
Using the SIPHER Synthetic Population, researchers were able to explore drinking patterns and socioeconomic circumstances of synthetic individuals residing across each local authority. This bypassed some of the limitations of traditional district-level analysis with aggregate-level data, which can often obscure health inequalities. It enabled detailed comparisons within and between local authorities and researchers found evidence for a strong linear relationship between deprivation – as measured by the Index of Multiple Deprivation (IMD) - and high alcohol consumption in specific areas (see Figure 1).
The higher the deprivation of an area (as reflected by an increasing IMD rank), the higher the percentage of people drinking 5 or more drinks on a typical drinking day.
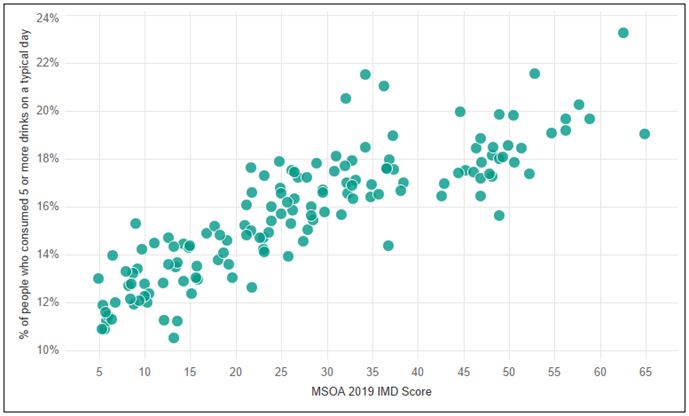
Figure 1. Relationship between Deprivation Levels (IMD) across Middle layer Super Output Areas (MSOAs) and the percentage of Individuals consuming five or more alcoholic drinks on a typical day.
Note: Deprivation levels were obtained from the Index of Multiple Deprivation (IMD). MSOAs are small areas capturing approximately 5,000 to 15,000 individuals
The SIPHER Synthetic Population enabled further analyses within each local authority. For example, for the local authority of Bury, it revealed variations in drinking behaviours across smaller areas within this local authority see Figure 2. Across Bury, the percentage of people consuming 5 or more alcoholic drinks on a typical drinking day ranged from 11.3% in some areas to just over 18% in others.
This highlights how synthetic data can reveal important insights on health inequalities at a granular spatial level.
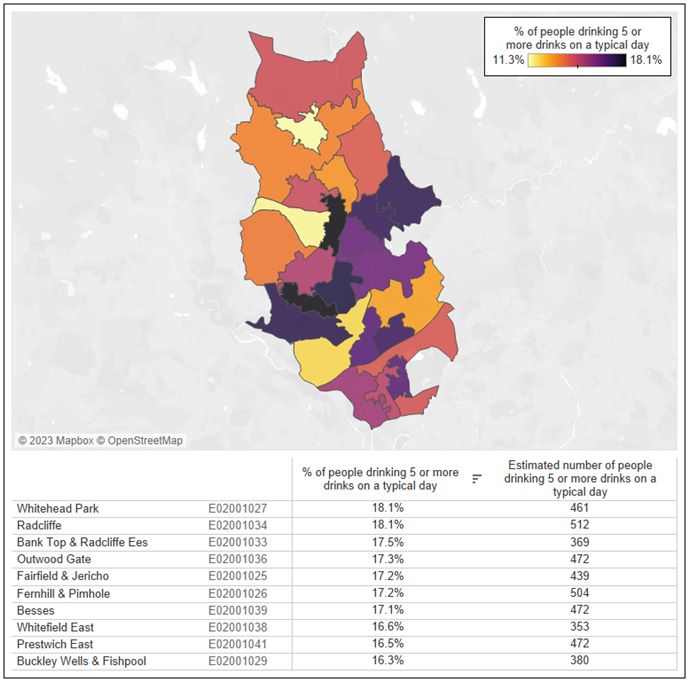
Figure 2. Estimated percentage of people in Bury consuming five or more alcoholic drinks on a typical day, displayed at the MSOA Level.
Researchers were also able to investigate other factors, such as alcohol consumption across different employment sectors within particular areas. As shown, in Figure 3, researchers found that lower supervisory and technical roles were more likely to report consuming five or more alcoholic drinks on a typical day when alcohol is consumed (23.7%).
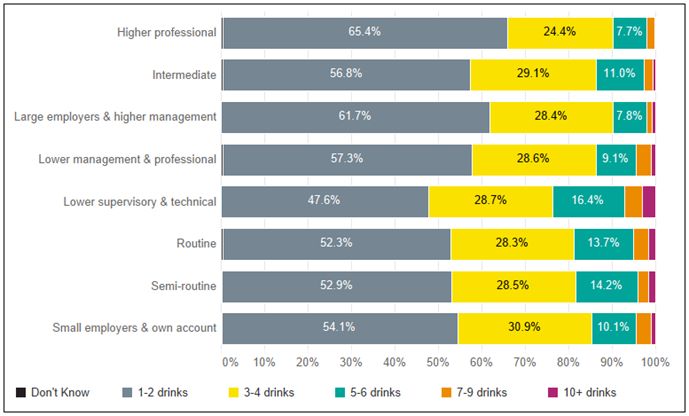
Figure 3. Estimated percentage of people across Greater Manchester consuming different amounts of alcoholic drinks, on days they drink alcohol, sorted by employment sector.
The evidence linking alcohol consumption with factors such as area deprivation, employment status, and occupational class can now help identify potential intervention points and targeted policy actions.
This case study illustrates how the SIPHER Synthetic Population can help to explore health and health inequalities at smaller-area levels and across locations of interest.
How to access the SIPHER Synthetic Population
- The SIPHER Synthetic Population Dataset is available for independent use via the UK Data Service (SN9277). Our dataset is accompanied by a detailed User Guide. The User Guide offers practical advice, documents the creation process, provides examples of our quality control.
- The SIPHER Synthetic Population Dashboard is a publicly available R-Shiny dashboard which enables a user-friendly ‘click-and-explore’ approach to the dataset. The dashboard allows users to explore an aggregated version of the dataset - without any need to write code or download and prepare data. Users can create custom area profiles, develop visualisations, and download data for local authorities and electoral wards.
For access visit Links and further reading at the end of this blog.
Challenges & Outlook
Creating synthetic data reflecting entire populations is still a relatively novel undertaking. Despite recent advances, significant challenges persist in developing these "digital twins", including the limited availability of real-world data for underrepresented groups such as children, minorities, and marginalized communities.
We aim for our transparent and reproducible approach to generating and sharing the SIPHER Synthetic Population to inspire further innovation and collaboration in this area, and welcome enquiries from those interested.
The views and opinions expressed in this blog are those of the author/authors.
Links and further reading:
- SIPHER Synthetic Population for Individuals in Great Britain Dataset: summary with links to all related resources including:
SIPHER Synthetic Population for Individuals in Great Britain, 2019-2021 Dataset (UK Data Service, SN9277) - available via the UK Data Service under a general end-User license agreement shared with a comprehensive User Guide (UK Data Service part of SN9277 Documentation)
SIPHER Synthetic Population for Individuals in Great Britain, 2019-2021 – Supplementary Material (ReShare) – documents the creation of the dataset and provides some examples of our quality control
- SIPHER Synthetic Population Dashboard – enabling a code-free exploration of the SIPHER Synthetic Population - without any requirement for coding or data preparation.
SIPHER Synthetic Population Dashboard Reproducibility Pack - contains all aggregate-level data provided in this dashboard, alongside all code which was developed to support dashboard functionality.
- Peer-reviewed research paper in Nature Scientific Data describing the methodology of the Synthetic Population dataset creation in full detail: A synthetic population dataset for estimating small area health and socio-economic outcomes in Great Britain.
First published: 15 October 2024
<< Blog

By Abi Finn, Embedded Researcher GMCA and Andreas Hoehn, SIPHER Researcher
Please direct 'SIPHER Synthetic Population’ enquiries to: sipher@glasgow.ac.uk