

Ethnicity Pay Gap
The University applies demographic categorisation in accordance with the Higher Educational Statistics Agency (HESA) for the purpose of this exercise consistent with HE practice. Similarly, we widely apply the term ‘Minority Ethnic’, which we have relied upon throughout our equal and pay gap reporting to denote those social groups who may have been subject to historic and contemporaneous forms of racism and exclusion.
It is recognised that such aggregate forms of conceptualisation are not ideal and may mask important differences between groups. It should be noted however that lower levels of colleague disclosure on ethnicity prohibit further breakdown into separate ethnic groupings to protect the confidentiality of individuals. This data is reviewed internally to identify and redress any potential areas to be addressed.
The Ethnicity Pay Gap is calculated by comparing the average and median salary of colleagues categorised as ‘Minority Ethnic’ with their respective ‘White’ colleagues.
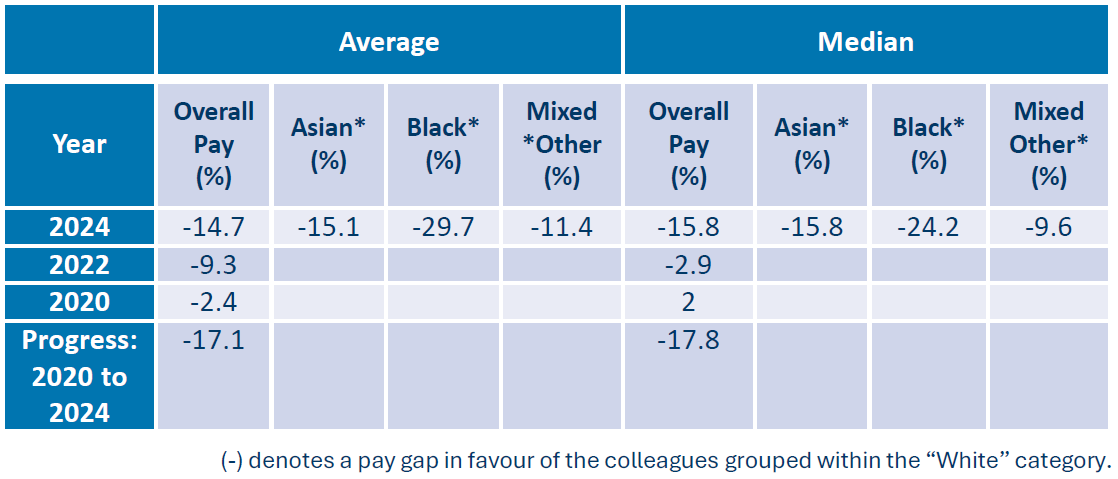
Table 5: UofG Average and Median Ethnicity Pay Gaps: 2020 - 2024
The Ethnicity Pay Gap has progressively widened across reporting years, driven by a range of influencing factors. These factors include large increases in Minority Ethnic representation at lower Grades, especially at Grade 5, as well as significant improvements in data reporting.
Those yet to disclose ethnicity information has reduced significantly since 2022 and stands at 6% in 2024 with 2% preferring not to share their information.
Whilst this has seemingly created an apparent widening of the pay gap, in practice, it has, in fact, created a more robust and accurate demographic profile and pay gap analysis than has previously been possible. Moreover, these improvements help us to better understand the factors impacting upon our Ethnicity Pay Gap and ensure our actions to tackle the gap are more clearly evidence-based and aligned to known issues.
The University has significantly increased its Minority Ethnic representation across our population over the reporting period, most notably with a 75% increase compared to a 17% increase in the White population between 2022 and 2024. Colleagues of Minority Ethnic background comprise 19% of the overall staff population in 2024, compared to 12% in 2022.
As evidenced in Figure 2, occupational segregation is a determining factor in the widening of the pay gap observed since 2022.
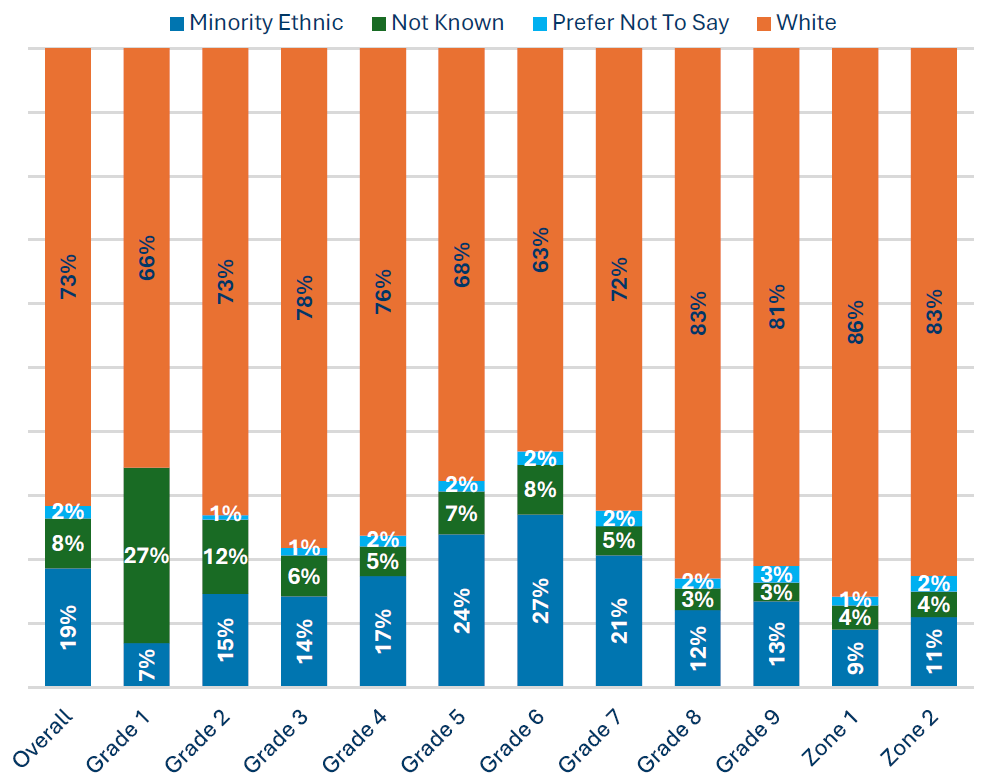
Figure 2: Demographic Spread: Graded and Zoned Staff [6]
The impact of horizontal segregation is underscored by the doubling or our Minority Ethnic population within Grades 1 to 5 to 24% since 2022, whereas the White population has had a slightly more modest increase of 21% within this cohort. This large increase has impacted average and median salaries amongst the Minority Ethnic group. This has led to the corresponding data being suppressed to a greater extent than that of our White colleagues, who are over-represented at more senior and higher paid levels.
It should be noted that the Minority Ethnic population increased by 49% at more senior and higher paid roles in comparison to our White population, the latter of which only increased by 18%. That being said, given the scale of our White population at more senior levels, it will take some time before such increases begin to have an impact.
As outlined previously, different rules apply to Ethnicity Pay Gap reporting. As such, equal pay reporting requirements for gender do not apply to ethnicity. Despite this, the University considers it important to apply the same depth of analysis to all pay reporting.
This year the University can publicly report the pay gap at Zone 1 and 2 compared to 2022 at which time data was available only for the aggregate grouping at professorial level and reported accordingly given the small numbers in scope.
The overall pay gap for our Professoriate has decreased since 2022 from 2.7% to 1.2% in favour of Minority Ethnic groups. The University anticipates that we will be in a position to draw comparator analysis in future reports having reported pay gap analysis at Zones 1 and 2 levels.
Grades 4 and 5 continue to have a large pay gap, with the gap at Grade 4 widening since reported in 2022. Both grades have seen a significant increase in the number of colleagues disclosing ethnicity data since 2022. At Grade 4, this has reduced from 25% in 2022 to 6% in 2024; and at Grade 5 from 30% to 8% respectively.
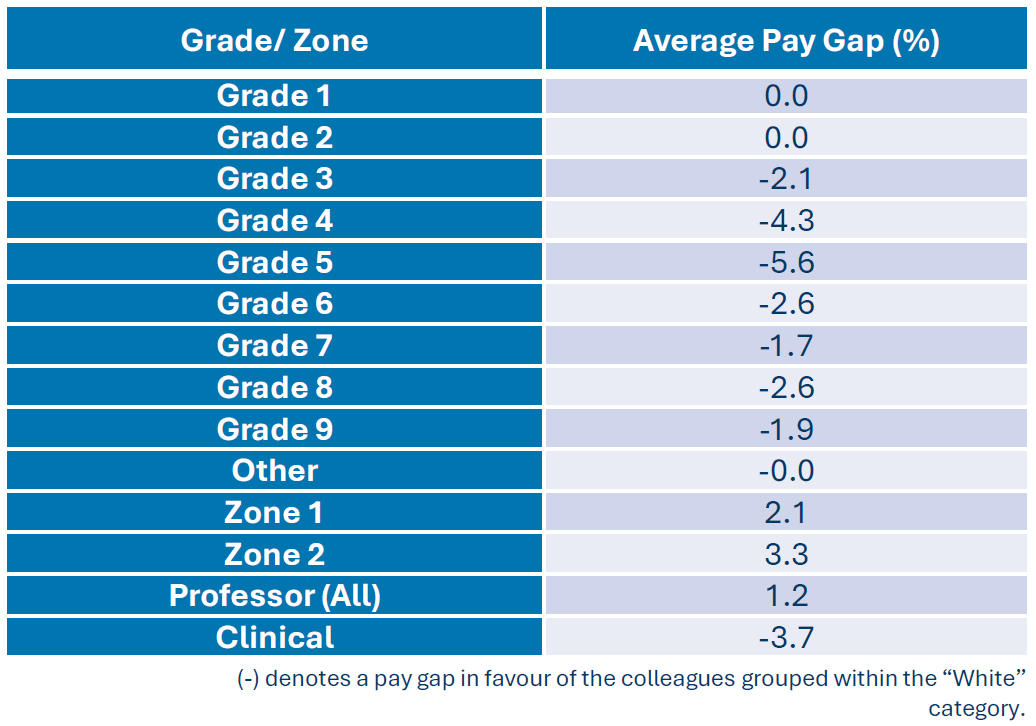
Table 6: Average and Median Equal Pay Gaps by Ethnicity across Graded and Zoned colleagues (September 2024)
[6] Due to small numbers and to maintain colleague confidentiality, the University is unable to publicly report on the following groups: Grade 10, Zone 3, Zone 4 Professors, Non-zoned Professors and SMG. The University actively monitors these groups to identify any potential areas of concern.