

Disability Pay Gap
The University applies demographic categorisation in accordance with the requirements of HESA when collecting colleague disability data. The disability pay gap is calculated by comparing the average and median salary of disabled colleagues with the respective statistical data for non-disabled colleagues.
Historically, low disclosure rates made it difficult to conduct meaningful pay gap analysis by disability status. Despite this, the University can report that the number of those who have yet to disclose disability related data has reduced significantly from 29% in 2022 and now stands at 3.4% in 2024. However, this data must be considered in a context that only 9.2% of University colleagues have disclosed as disabled and a further 7.5% have chosen not to share disability related information.
The University can report progress in having reduced our disability pay gap and shows a decrease of 3.7% since 2020.
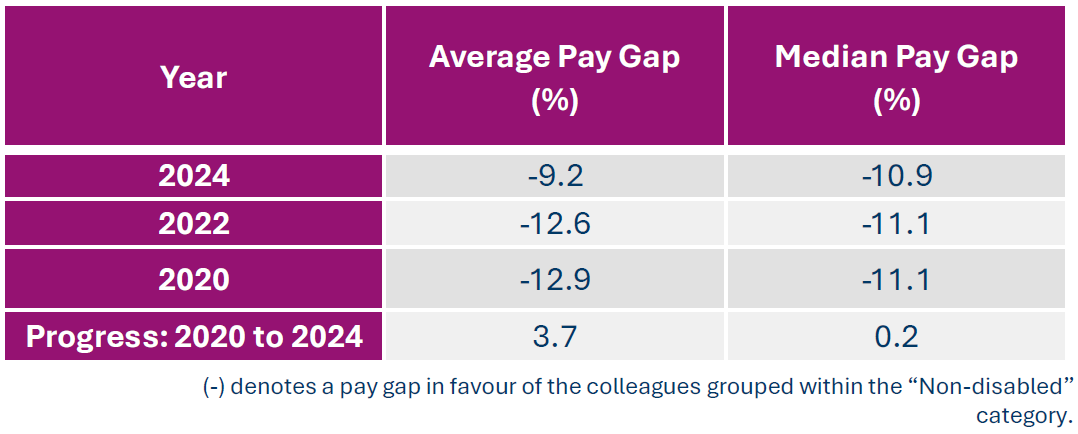
Table 7: UofG Average and Median Disability Pay Gaps: 2020 - 2024
The University is unable to categorically state the extent to which occupational segregation impacts upon our disability pay gap given the small numbers of those in scope.
Colleagues having disclosed disability related information constitute 7% of our professoriate. Further, pay gap analysis of this cohort highlight that this group are, on average, paid higher than their non-disabled colleagues. However, this must be considered in the context that 11% of our professoriate have yet to share their disability status.
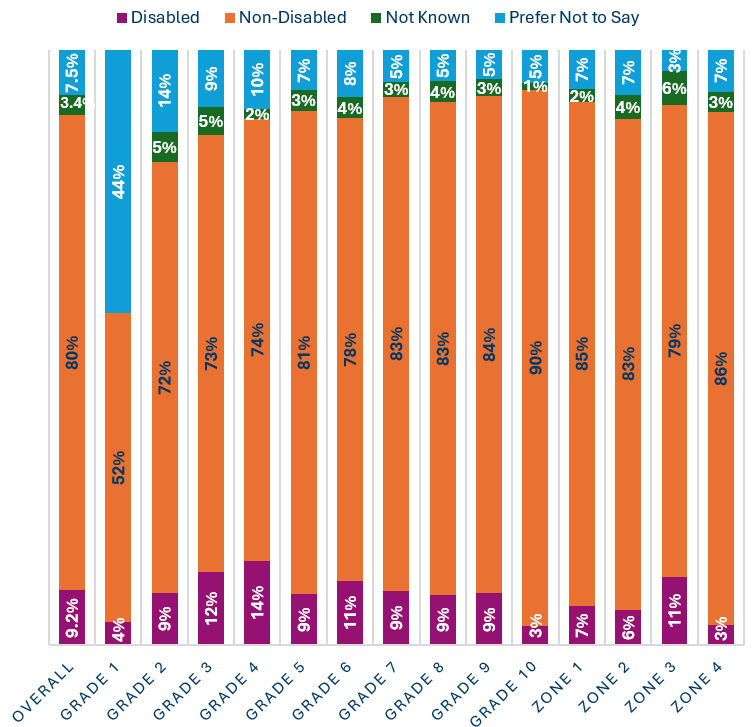
Figure 3: Demographic Spread of Disability Categories: Graded and Zoned Staff
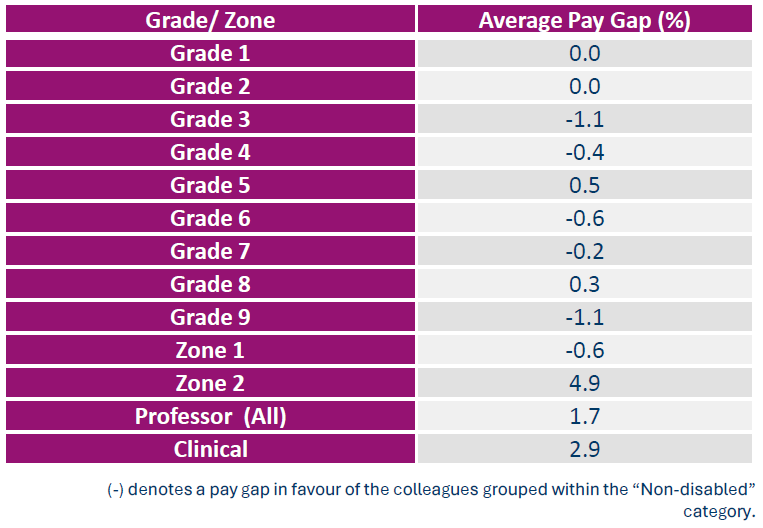
Table 8: Average and Median Equal Pay Gaps by Disability across Graded and Zoned colleagues (September 2024)